Retail
Your Best Seller Might Be Losing You Money: Contribution Margin for Indonesian Retailers
Gross margin tells you what a product earns on paper. Contribution margin tells you what it earns after the discounts, commissions, shipping subsidies, ad spend and consignment splits that Indonesian retail actually runs on. What the number is, how to calculate it three ways, why it decides your break-even point, and what it takes to track it per SKU and per channel without a spreadsheet.
· Winston Lays
Ask a retailer which product sells best and you get an answer in seconds. Ask which product earns best and the room goes quiet — or someone opens a spreadsheet and asks for the afternoon.
That gap is not a reporting problem. It is a margin problem wearing a reporting costume, and it usually resolves the same way: the top seller by volume turns out to be somewhere near the bottom by contribution, because it is the one the team keeps discounting to keep it on top.
What contribution margin actually is
Contribution margin is the money left from a product’s sales revenue after you subtract every variable cost tied directly to selling that item.
The name is the definition. What is left over contributes — first to covering your fixed costs, the rent and the store manager’s salary and the insurance that you owe whether you sell one pair of shoes or a thousand, and only then to net profit. Below a certain contribution, a product is not a small win. It is a subsidy your other products are paying for.
Three ways to read the same number
| Form | Formula | Answers |
|---|---|---|
| Total | Sales revenue − total variable costs | Is this line, channel or store carrying its share? |
| Per unit | Price per item − variable cost per item | Should we buy more of this SKU? |
| Ratio (%) | (Contribution margin ÷ sales revenue) × 100 | How much discount room do we actually have? |
All three describe the same thing at different zoom levels. The per-unit number drives buying decisions. The ratio drives pricing and promotion decisions, and — as we will get to — it is the number that sets your break-even point.
What counts as a variable cost
The test is simple: if you sold zero units, would this cost be zero? If yes, it is variable and it belongs in the calculation.
- Cost of goods sold. What you paid your supplier for the item, landed.
- Shipping and fulfillment. Packing materials, postage, and third-party pick-and-pack fees.
- Transaction fees. Card processing, payment gateway charges, marketplace commissions.
- Sales commissions. Anything paid to staff per item sold, including counter commissions.
- Attributable ad spend. For online channels, the advertising you can trace to acquiring that specific sale. A brand campaign that runs regardless of volume is a fixed cost; a product-level ad that only exists to move that SKU is not.
Rent, utility bills and permanent staff wages stay out of it. They are real costs and they still have to be paid — but they are paid out of contribution, not subtracted from it.
Where the costs sit depends on how you fulfill
The formula does not change between a store and a marketplace. The line items underneath it change almost completely — which is why a single blended margin assumption is the most common way retailers get this wrong.
In a physical store
Variable cost concentrates in inventory and in the people standing next to it.
- Landed cost of goods. Not just the wholesale price. Inbound freight, customs duty and import handling all belong here, because they scale with what you buy. A brand principal’s price list is the start of the number, not the number.
- Floor and counter commission. Percentage payouts and performance bonuses tied to what staff actually sell. In consignment this is doubly variable: the department store takes its share, and your counter staff take theirs on the same unit.
- Shrinkage and damage. Stock that is lost, stolen, damaged or written off. Most retailers treat it as an annual adjustment rather than a per-unit cost, which is exactly why it never shows up against the products causing it. It is a variable cost by every test that matters — it scales with volume, with handling, and with how many locations your stock passes through.
Shrinkage deserves the extra attention in Indonesian retail specifically, because so much stock sits in premises you do not control. A pair of shoes at a consignment counter is inside someone else’s store, handled by someone else’s staff, and a discrepancy is typically discovered at the next stock count rather than on the day it happened. The longer that gap, the more expensive it is — and the harder it is to attribute to anything.
Online
Variable cost shifts away from the shop floor and onto fulfillment and acquisition.
- Outbound shipping and packaging. Boxes, polymailers, filler, and a carrier fee per parcel — JNE, J&T, SiCepat, Anteraja, or an instant courier for same-day. Where you have opted into a free-shipping programme to stay visible in the filter, part of that subsidy is yours, per order.
- Payment and transaction fees. Gateway charges typically run in the low single-digit percentages plus a fixed fee per transaction, QRIS carries its own regulated merchant rate, and marketplace commission sits on top of both. Three separate deductions, three separate statements.
- Cost per acquisition. The ad spend you can attribute to a specific conversion. Unlike the others, this one is set by an auction you do not control — so the same SKU can carry a different acquisition cost this month than last, with nothing about the product having changed.
The shape of the difference
| Cost category | Physical store | Online |
|---|---|---|
| Logistics | Low — bulk freight to one location | High — one parcel per order |
| Transaction fees | Low — standard card or QRIS at the counter | High — gateway plus platform commission |
| Labour and marketing | High — floor and counter incentives | High — per-conversion ad spend |
| Shrinkage | High — and often found late | Low — but returns take its place |
Read down the columns and you can see why the two models rarely land on the same ratio. Read across, and you can see why a business running both cannot answer the margin question with one number.
Most Indonesian retailers of any size are running both. That is the whole problem.
Same shoe, two channels
Here is what that looks like on one product sold two ways. The numbers are illustrative; the shape is not.
A pair of shoes, listed at Rp 799,000, landed cost Rp 320,000.
| Marketplace, campaign week | Consignment counter | |
|---|---|---|
| List price | 799,000 | 799,000 |
| Promo discount | −239,700 (30%) | — |
| Sales revenue | 559,300 | 799,000 |
| Platform commission / revenue share | −44,744 (8%) | −239,700 (30%) |
| Payment and transaction fees | −11,186 (2%) | — |
| Shipping subsidy and packaging | −30,000 | — |
| Attributable ad spend | −25,000 | — |
| Counter sales commission | — | −16,000 (2%) |
| Transfer and handling to location | — | −8,000 |
| Returns and shrinkage allowance | −12,000 | −6,000 |
| Cost of goods | −320,000 | −320,000 |
| Contribution per unit | 116,370 | 209,300 |
| Contribution margin ratio | 21% | 26% |
Same shoe. Same supplier cost. The counter contributes 80% more per pair than the campaign does.
Nothing in your product master would tell you that. Cost of goods is identical in both columns — every rupiah of the difference sits in costs that attach to the channel, not to the item. Which is exactly why they end up unmeasured: they are recorded in five different places, by four different people, in three different systems.
Why this matters more now than it did two years ago
Three things changed, and they compound.
Discounting stopped being seasonal. Indonesian marketplace retail now runs on a near-continuous campaign calendar — double-date sales, payday sales, live commerce, flash windows. A discount that used to be a quarterly event is now a monthly operating condition. If your margin analysis assumes list price, it is wrong most weeks of the year.
Channel costs got layered. A single online sale can carry a platform commission, a payment-gateway fee, a shipping subsidy you agreed to in order to appear in a free-shipping filter, a voucher you part-funded, and the ads that put the listing in front of the buyer. Each is small. Stacked, they routinely exceed the gross margin the merchandising team planned against.
Capital got expensive. Growth funded on cheap money forgives a lot of margin sin. Growth funded on your own working capital does not. When every rupiah of inventory has to earn its place, “which SKUs should we buy more of” becomes a question with real consequences — and volume is a bad way to answer it.
There is a fourth reason, specific to how Indonesian fashion and consumer retail work: demand concentrates. Saga Machie’s business spikes heavily around Ramadan, and that pattern is common across the sector. Allocating stock badly across 34 locations costs something in a flat month. In a peak month it costs the peak — and peak is precisely when you have the least time to build the analysis and the most riding on it.
Three decisions the number actually changes
It tells you which products are genuinely profitable. Gross margin only looks at what the item cost you. Contribution margin adds the per-item expenses that never make it onto the product record — fulfillment, platform cuts, floor commission, ad spend. A product line can look healthy on gross margin and be flat on contribution, and the two rankings are often not in the same order.
It tells you how far you can discount. Discount headroom is not a feeling; it is your contribution margin ratio. At 26% you have a defined amount of room before a promotion stops contributing anything to rent. At 21% you have less. Run the same campaign across both channels at the same depth and you are quietly funding one of them.
It tells you what you have to sell to break even. Divide total fixed costs by the contribution margin ratio and you get the revenue the business needs to produce to stop losing money:
Break-even revenue = total fixed costs ÷ contribution margin ratio
Say your fixed costs run Rp 180 million a month. At a blended 26% ratio you break even at about Rp 692 million in revenue. Shift your sales mix toward the 21% channel and the same fixed costs now need about Rp 857 million — roughly Rp 165 million of extra revenue every month to stand exactly where you were.
That is the version of this that gets attention in a management meeting. A five-point move in a ratio nobody was tracking quietly raised the bar the whole business has to clear.
The real obstacle is not the formula
The maths above is arithmetic. Any finance team can do it. The reason most retailers still cannot see contribution margin by SKU and by channel is that the inputs live apart:
- Cost of goods sits in the procurement system, or in the last purchase order, or in someone’s memory of what the supplier charged before the rate moved.
- Actual net price sits in each marketplace’s back office, one dashboard per platform, each with its own export format and its own definition of “net”.
- Commissions and fees arrive on a settlement statement, weeks later, often at order level rather than line level.
- Consignment revenue share sits in an agreement with each department store partner, applied by hand, per counter.
- Ad spend and movement costs sit in an ads dashboard and a delivery note, if they were captured against the product at all.
Assembling that into one view is a job. Assembling it every month is a headcount. So it gets done once, for a board deck, and then never again — which means it is never available at the moment a buying decision is being made.
That is the actual failure. Not that the number is hard to calculate. That it is not there when you need it.
How Delos Retail closes the gap
Delos Retail is built so those inputs stop being scattered in the first place.
One stock position, one product record, every channel. Physical stores, consignment counters and marketplace channels all sell against the same inventory, with each channel priced and allocated on its own terms. The unit cost and the actual selling price for a given sale are attached to the same transaction rather than reconciled between systems afterwards.
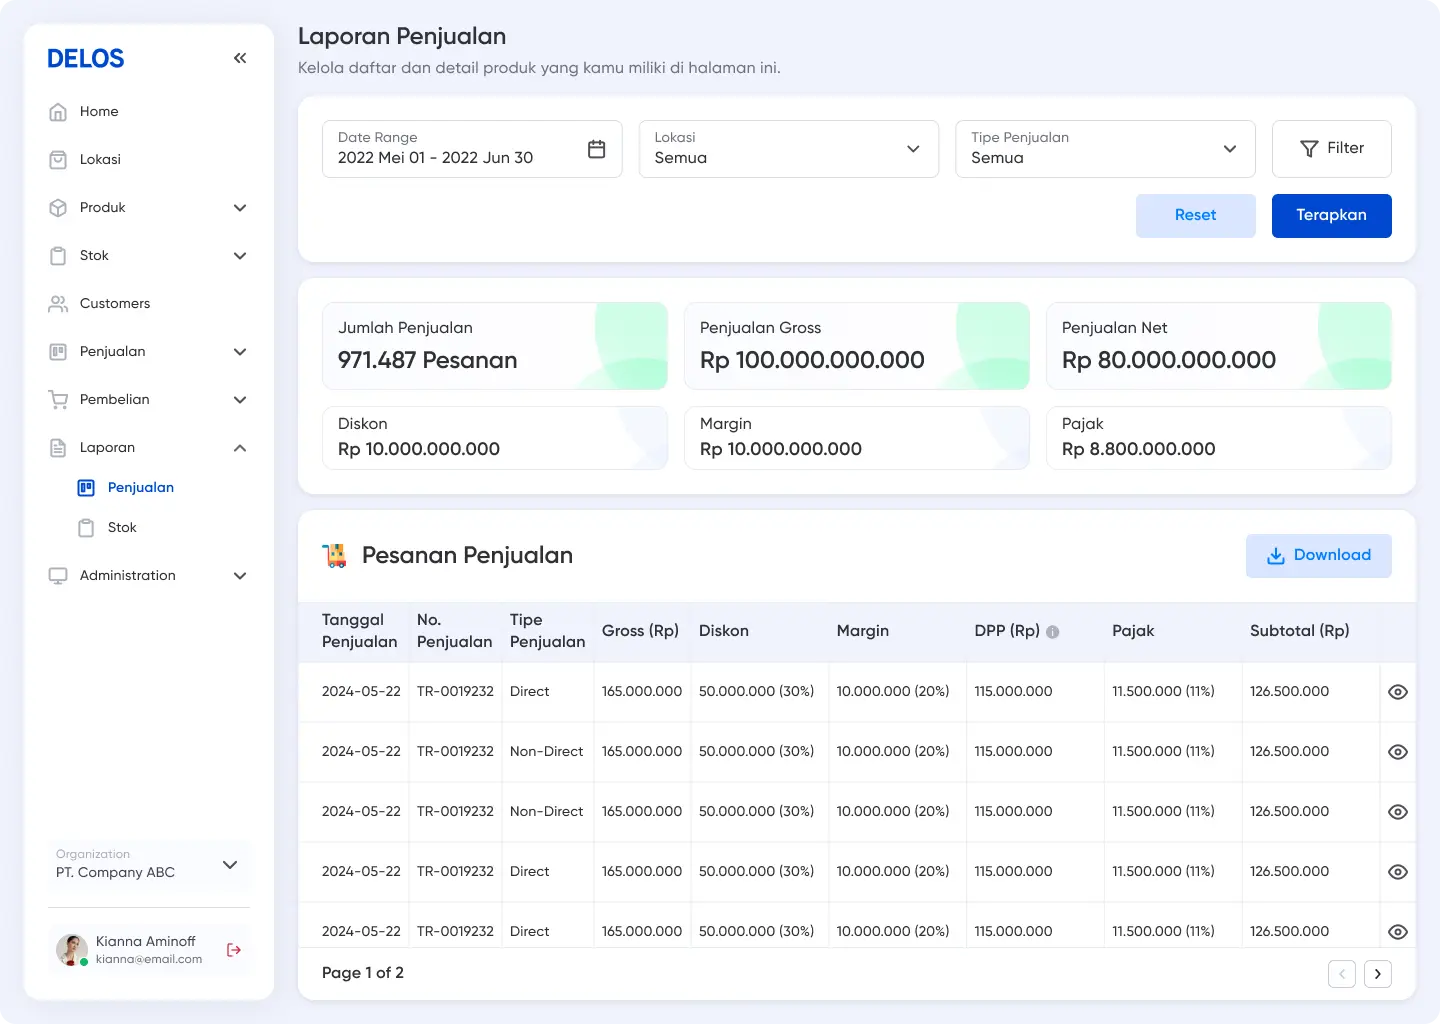
Discount captured at the line, not inferred later. Sales reporting carries gross sales, discount, net sales, margin and tax together. When a campaign runs, the reduction is recorded against the sale that carried it, so the effect on margin is visible in the same report as the volume it produced.
Consignment revenue share as a first-class calculation. Revenue share is computed per partner and per item — not applied as an afterthought to a monthly total. Each counter holds its own stock position and reporting requirements inside the system, which is what makes per-counter contribution a query rather than a project.
Shrinkage that becomes a number instead of a surprise. Stock movements are tracked through draft, in-transit and confirmed states, and stock counting runs against the system rather than beside it. A discrepancy surfaces against the location and the movement that produced it, close to when it happened — which is the difference between a cost you can act on and an annual write-off nobody can attribute.
Merchandising analytics on what actually sold. Product performance is categorised against real transactions, so buying decisions rest on measured results rather than on what the team remembers selling well.
Journal entries into the ledger you already close on. Delos Retail runs the operation and hands finance the entries it produces. Sales, transfers and goods receipts arrive in Accurate Online or Oracle NetSuite as journal entries mapped to your chart of accounts. Operational reality and financial reporting stop being two separate accounts of the same month.
Being straight about the boundary: your accounting system still owns the statutory close, settlement-level platform fees still arrive on the platform’s schedule rather than yours, and ad spend lives in the ad platform. What changes is that the operational half — unit cost, real net price, discount, revenue share, location, channel — is already assembled and already current when finance goes looking for it. That is the half that usually costs a week.
Where to start
You do not need a platform to start. You need one honest afternoon.
Take your top ten SKUs by volume. For each one, pick your two biggest channels and work the table above by hand — list price, actual average discount, platform fees, fulfillment, any ad spend you can attribute, an honest allowance for returns and shrinkage, and landed cost. Ten SKUs, two columns each.
Then do one more calculation: divide last month’s fixed costs by the blended ratio you just produced, and compare that number to what you actually sold.
Most retailers find at least one product they have been protecting that should be repriced, at least one they have been ignoring that deserves more inventory, and a break-even number higher than they assumed.
The harder question comes next: how long would it take to produce that same table again next month, and the month after? If the answer is “another afternoon”, the number will not survive contact with a busy quarter — and the decisions it should have informed will get made on volume instead.
If you would rather it were a report than an afternoon, book a walkthrough and we will show you how it looks against your own channels.